
 Improve this document
 Create an issue
 Edit on GitHub
This document is also available in PDF format.

Colophon
Suggested citation
Astorga F, Rodrigues A & Waller J (2024) Sensitive species data generalization: Exploring risks, benefits and best practices. Copenhagen: GBIF Secretariat. https://doi.org/10.35035/doc-yr9g-nx02
Licence
The document Sensitive species data generalization: Exploring risks, benefits and best practices is licensed under Creative Commons Attribution-ShareAlike 4.0 Unported License.
Executive Summary and Recommendations
This report provides an overview of existing frameworks for identifying and generalizing sensitive species data and explores the utility of the global IUCN Red List of Threatened Species™ and CITES Appendices for identifying sensitivity in the data. Where known sensitivities exist within the data, we assessed GBIF-mediated data to evaluate the degree to which publishers are generalizing those data.
The report identifies a range of well-developed protocols at national (through GBIF nodes) and organizational levels for identifying and generalizing sensitive species. However, most GBIF´s data publishing community does not appear to use such protocols, and this report provides an opportunity to share best practices more widely within the GBIF community. While it is tempting to rely on global lists such the IUCN Red List and CITES to define sensitivity within the data, these global lists fail to capture sensitivities at more local levels, and using these global proxies may over- or undergeneralize the data, which would affect both local reuse and global security concerns. As a result, we encourage national and regional approaches for developing sensitive species data frameworks.
The majority of species considered sensitive do not have fully generalized occurrence data, i.e. a proportion of occurrences for these species will not be generalized. However, occurrence generalization rates tend to be higher for records of species considered as sensitive compared with those that are not, and even higher for repatriated records for species in countries in which they are listed on those national sensitive species lists. Where it has been generalized, data is inconsistently generalized between data publishers, and the sensitivity within the data is inconsistently flagged across datasets. In this report, we observe this phenomenon using two well-known sensitive taxa: rhinos (Rhinocertidae) and orchids (Orchidaceae). Data publishers need more support to ensure future reusability of the data through richer dataset metadata, fixed vocabularies for those terms commonly used for data generalization, and training on best practices for data generalization.
It is important to note that, despite these challenges and limitations, GBIF is ahead of other biodiversity data platforms with regard to the handling of sensitive species data, most notably compared to social media, which may not have guidelines or generalization protocols in place for sensitive species data. Even with these relatively well-developed guidelines in place, we would encourage the use of generalization as an exception to the rule to ensure that data remain as broadly informative as possible for future reuse in research and conservation.
Introduction
GBIF provides more than two billion occurrence records from thousands of data publishing institutions worldwide, and the data are freely and openly reused in a range of science and policy applications (Adams 2017; Angarita-Sierra et al. 2022; Ariño 2014; Astorga et al. 2023; Ball-Damerow et al. 2019; Borgelt et al. 2022; Chapman 2006; Chapman 2020; ENETWILD consortium et al. 2022; Estrada-Peña & de la Fuente 2014; Heberling et al. 2021; Heinicke et al. 2021; Hochachka et al. 2012; Kelling et al. 2009; Lindenmayer & Scheele 2017; Powney & Isaac 2015; Robinson et al. 2020; Saarenmaa 2005; Soberón & Peterson 2004; Tang 2021; Thompson et al. 2021; Wood et al. 2011; Xing et al. 2019). This data can be sensitive in nature, revealing localities of species that could increase threats to individuals or populations. In recognition of this, GBIF provides robust documentation in the guide to best practices for generalizing sensitive data (Chapman 2020), which can help data publishers to generalize their data in a manner consistent with the principles of open data.
Despite active efforts by the GBIF communtiy to offer guidance and standardize processes for generalizing sensitive data, concerns are still often raised about the possible availability of sensitive data. At the same time, there is an increasing awareness at a national level of the importance of restricting access to some sensitive data. The challenge is finding the balance between free and open data at resolutions that are useful for answering scientific questions and generalizing or restricting data for reuse to ensure that data is not used for nefarious purposes (Contreras-Díaz et al. 2023).
In this report, we investigated existing approaches for identifying sensitive species data and examined how sensitive data within GBIF is currently managed, with a view toward identifying best practices already in use within the GBIF community. Based on these findings, we explored potential improvements in the data publishing workflow for facilitating the publication and reuse of sensitive species data to ensure that data are as precise as possible, and as generalized as needed.
Sensitive species are defined in this report as taxa potentially threatened by targeted use, e.g. hunting, collection, pet trade, or through human disturbance, e.g. wildlife watching. Sensitive species data is defined here as any data which, if released to the public, could potentially result in adverse effects on the populations or individuals of sensitive species. We have not focused on other potential reasons for sensitivity within the data, including biosecurity and traditional knowledge, while understanding that these factors should be considered in future discussions on sensitive data. The acquisition of data for all analyses was completed in January 2023.
1. Defining sensitive species
Without a good understanding of the potential threats to a species, one of the first hurdles for a data publisher is making a decision on which data should be considered sensitive and thus generalized. The question is: will publishing such data on a given species at a specific moment in time increase the risk to that species from targeted exploitation? In this section, we explore the frameworks used by a number of data publishers and GBIF nodes to identify and generalize sensitive species data.
1.1. Organizational and national/subnational sensitive species data frameworks
The identification of potentially sensitive species and sensitive data may take diverse approaches and frameworks, ranging from simple binary decision to more complex multistep processes (e.g. SANBI 2018; SINP 2017). The elaboration of sensitive species lists are, in general, collaborative in nature, and their level of complexity varies between countries and organizations.
For example, organizations such as Système d’information de l’inventaire du patrimoine naturel (SINP) in France and the South African National Biodiversity Institute (SANBI) have established national working groups that develop sensitive species lists and their associated generalization protocols in France and South Africa, respectively (Table 1). Some working groups enable these processes to be consultative across a broad range of stakeholders. SANBI and iNaturalist also provide user feedback mechanisms with which the user community can inform those organizations regarding concerns about the classification of species as sensitive.
These lists are often dynamic and reflect current changes to pressures at national or regional levels. For example, SANBI´s working group periodically reviews the list as new information becomes available, resulting in a dynamic list where the number of species can change (504 in 2010, reduced to 129 in 2018) as well as a watchlist of genera that could become sensitive in the future (SANBI 2010; SANBI 2018). Only a few institutions, however, provide full documentation of these processes. Among these, we identified SANBI as having a particularly well-developed set of documentation (SANBI 2010; SANBI 2016; SANBI 2018).
| Institution | General description | Geographical scope | Number of taxa |
|---|---|---|---|
Atlas of Living Australia |
Compilation of sensitive species lists generated within Australia´s states and territories |
Australia & New Zealand |
5,609 |
Système d’information de l’inventaire du patrimoine naturel (SINP) |
SINP works with both national and local governmental and non-governmental institutions to prepare its sensitive species lists. SINP has a well-developed data management protocol that incorporates administrative boundaries and seasonal variation. |
France, Reunion, French Guiana |
2,868 |
SLU Swedish Species Information Centre and Swedish Biodiversity Data Infrastructure (SBDI) |
SLU publishes its sensitive species list via GBIF as well as the corresponding generalization protocols |
Sweden |
130 |
National Biodiversity Network |
Data providers give access to the data through NBN website |
United Kingdom (England, Scotland, Wales, Northern Ireland and Isle of Man) |
142 |
South African National Biodiversity Institute |
The National Sensitive Species List (NSSL) is developed by a permanent working group in collaboration with SANBI. Robust documentation related to guidelines and protocols |
South Africa |
129 |
eBird |
The international citizen science project operated by the Cornell Lab of Ornithology works with local partners to develop its sensitive species list |
85 countries |
385 |
iNaturalist |
Although iNaturalist offers global recommendations on sensitive species, we found a list only for Canada |
Canada |
113 |
Finnish Biodiversity Information Facility |
FinBIF develops a sensitive species list through its protocol in collaboration with other national institutions |
Finland |
152 |
InfoSpecies |
Integrates different lists developed by institutions such as Ornitho and Info Flora. |
Switzerland |
63 |
Some citizen science projects have also developed their own protocols and lists. eBird and iNaturalist categorize sensitivity within the data for specific countries and taxa based on community consultation. Both initiatives are already implementing sensitive data policies, eBird in 2017 and iNaturalist in 2011 (Glaser 2019; iNaturalist 2022). iNaturalist automatically obscures species on its own sensitive species list, such as observation of certain orchids (iNaturalist 2023). iNaturalist community helps inform which taxa should have a taxon geoprivacy set by flagging taxa. In addition, iNaturalist encourages publishers to set geoprivacy settings to "obscured" for any records that they feel are sensitive. For obscured observations, the latitude and longitude are moved to private latitude and private longitude fields which are not publicly visible and the publicly available accuracy is increased to the diagonal of a 0.2 x 0.2 degree cell (~500 km2 at the equator). Latitude and longitude are replaced with a random point within this cell. In some regions, iNaturalist also works at the national level to harmonize their global approach with agreed-upon national approaches. For example, in Canada, iNaturalist has a working group, which works with NatureServe Canada’s Conservation Data Centers who establish and maintain the conservation statuses for each province and territory (except Quebec).
In this report we assessed these different frameworks against Chapman (2020^)´s framework to see to what extent these elements are addressed across different organizations´ frameworks (Appendix A). The two major elements of this framework are below, with sub-components of the framework in bold italics:
-
Is the taxon that we are publishing data on sensitive? e.g:
-
Is the taxon at risk of harm?
-
What will be the impact of the harm?
-
What is the conservation status of the species?
-
-
Will the publication of the data increase potential harm to the taxon? e.g:
-
Does the taxon exhibit features that make release of that data potentially harmful to that taxon?
-
Will the release of the data increase the probability of harmful activities?
-
Among the different guidelines and literature reviewed, the most widely used elements for identifying sensitive species data were the risk of harm and the conservation status, with further refinement following national stakeholder consultations. Most of the institutions referred to the IUCN Red List of Threatened Species (e.g. DRYAD), and others also applied local and national assessments of conservation status (ALA 2018; SANBI 2016). For risk of harm, threats identified within the frameworks related to the use of the species, the economic value of the targeted species, or how interesting specific groups found them (e.g. wildlife watchers). With respect to conservation status, for some organizations this was the only criterion used.
The assessment of the impact of harm is not simple, and the establishment of thresholds at which a specific activity can be viewed as a major threat remains unclear, particularly in cases with multiple threats. Based on the precautionary principle, institutions such as SINP do not necessarily require robust evidence of population susceptibility and may use knowledge of the effects of the threats on closely related species to inform decisions on which species are considered sensitive (Touroult et al. 2014). SANBI has developed a set of well-defined criteria for assessing impacts of harm: exploitation extent; targeted demographic; regeneration potential; and population vulnerability (SANBI 2010; SANBI 2018; Table 2). The criteria account for how harmful activities would affect a species given its ecology, demographics and exploitation intensity over time, providing the most robust attempt to qualify the impact of harm on species across all frameworks.
| Element | Response scales (categories) | Response description |
|---|---|---|
Targeted exploitation |
Small or insignificant |
Wild individuals of the species are known to be utilized (exploited, collected, traded, or utilized in a targeted manner), but utilization is localized and/or affects only a small proportion of the wild population. |
Significant |
Wild individuals of the species are known to be utilized (exploited, collected, traded, or utilized in a targeted manner), and utilization is widespread, affects most wild populations and/or is causing rapid decline of the wild population. |
|
Managed |
The species is utilized (exploited, collected, traded, or utilized in a targeted manner), but utilization is sustainably managed, e.g. the number utilized does not exceed the number produced by the wild populations. This should be examined on an annual basis. |
|
Uncertain |
No data exists yet showing that the species is exploited in the wild, however it has one or more relatives or look-alike species that are known to be utilized, making it highly likely that it would be exploited for the same purposes. |
|
Regeneration potential |
Fast population growth rate |
Good chance for the wild populations to recover from exploitation. |
Slow population growth rate, or the growth rate varies depending on habitat |
Poor chance for the wild populations to recover from exploitation OR a collector might feasibly harvest the entire extant population removing the chance of subsequent recruitment. For example, a gregarious species with a reproduction system that gathers all nests together facilitates the extraction of the entire existent population in a short period of time, removing the chance of subsequent recruitment. |
|
Population vulnerability |
Population is vulnerable |
Size is ≤ 2,500 mature individuals OR the number of known subpopulations is ≤ 5 OR range is ≤ 100 km2 OR species at risk of localized extinctions. |
Population is not vulnerable |
Size is > 2,500 mature individuals AND the number of known subpopulations is > 5 AND range > 100 km2 |
The second element of Chapman´s framework—whether the publication of the data would increase potential harm to the species—was not as widely used within the frameworks for determining the sensitivity of the data. Not all ungeneralized occurrence data of a sensitive species may pose a direct risk to populations of that species. For some species, even with precise knowledge of its location, its discovery is unlikely. This probability of finding the species again has been defined as its detectability (Bailey et al. 2004), which depends on factors including species mobility, home range, sociality, cryptic behaviours, local population density and territoriality (Bailey et al. 2004; Kéry & Schmid 2004).
For example, the elusive and critically endangered Andean cat (Leopardus jacobita) was recorded from a novel location in central Chile in 2018 as part of a camera trap monitoring program (GEF Montaña 2018). But despite continuous intensive fieldwork, the efforts to capture a new photo at the same location were unsuccessful. The cat was photographed again, but several months later and in a station a few kilometres away (Figure 1). In this example, the delivery of a precise location may not represent a significant risk for the species. In contrast, species with smaller distributions (e.g. a frog in a wetland), high densities and lower mobility may be easier to find. Chapman 2006 suggested that herbaria are more inclined to restrict their data, which coincides with our own finding that occurrence records of plant species tend to be more generalized (see below).
Even though we cannot assume a straightforward correlation, we might assume that, at least in part, data generators may perceive higher risks related to the lack of mobility of plants. Incorporating an estimation of the species detectability may improve the choice of corresponding spatial buffers applied for data generalizations. In species with lower mobility, smaller home ranges and/or behavioural traits or habits that lead to reduced movements of individual (e.g. philopatry), occurrences may be very precise without increasing threats to individuals. Some ecological studies and surveillance programs have incorporated detectability in their protocols, identifying species that require major efforts to be found (or re-detected) (Efford & Schofield et al. 2022; Howe et al. 2022; Theng et al. 2022; Tourani 2022). Including this element may be key to securely deliver more precise location information.
The accessibility of the location from which the species was recorded may also limit the impact of publishing ungeneralized data. Access to certain locations may only be possible with appropriate permits, training and/or equipment. For example, the burrowing parrot (Cyanoliseus patagonus) build their nests in cliffs along river banks in the Andes. Similarly, the long-flowered fescue (Patzkea paniculata subsp. longiglumis) is only known in France from one station in the Pyrénées-Atlantiques, located within rocky escarpments (Ichter et al. 2022).

The novelty of the data, e.g. an occurrence of a species in a location not previously reported, can also increase its sensitivity; but identifying truly novel data points is not a straightforward process. For example, if a species is known to occur in a province of a country with an area of 7,000 km², would it be safe to publish precise location information of this species within that province? Is that record considered a novel location or not?
Angarita-Sierra et al. (2022) attempted to address this issue in Colombia. For snakes, the authors compared “novel” data to data mediated through GBIF and defined “novel” as a record that occurs outside a buffer of 50-100 km from previously published locations. Records falling outside buffers represented range extensions and, thus, truly novel data. This example highlights the difficulties in finding an approach to define what would be considered a novel location that may increase threat or, in contrast, if the data point does not represent novel information, falling within a known species´s distribution. The relevance of these records located in known distribution is that they may contribute with valuable ecological information of population dynamics along time.
1.2. The complementarity between national/regional lists and global lists
Good examples exist of well-developed sensitive species data frameworks that allow for the identification of sensitive species on which data generalization protocols can be applied. However, these frameworks and guidelines are limited to a handful of countries or taxonomic groups (Table 1). Given these large geographical and taxonomical gaps in our knowledge of where sensitivity may lie, we explored the utility of developing a global trigger lists that could be used to flag those taxa where we might expect sensitivity in the data. For this, we used the IUCN Red List of Threatened Species (often cited as a reference for the development of national sensitive lists) and the CITES Appendices (Convention on International Trade in Endangered Species). We wanted to investigate the extent to which the signal within IUCN-derived and CITES-derived sensitive species checklists are reflected within national and organizational lists. If the correspondences existed between national and organizational sensitive species lists and these global lists, then the global lists could potentially serve as useful reference indicators of data sensitivity for data managers to use in generalization of sensitive taxa.
For the IUCN Red List, we identified potentially sensitive species if “biological resource use” had been recorded as a threat to the species under the IUCN´s Threat Classification Scheme IUCN (2022), only including those subcategories in which the biological use was classified as “intentional, species is the target”. This threat classification was deemed most likely to identify taxa that would be subject to targeted hunting, gathering, harvesting, or other similar activity that may result in increased species data sensitivity. From the near 150,000 species currently assessed in the IUCN Red List, we found 12,890 potentially sensitive species,excluding those species where the threat from biological resource use could not be directly attributed to the species. From this IUCN-based list, 40 per cent of the species were categorized as Least Concern, and the remaining as Data Deficient (6.7 per cent), Near Threatened (11.3 per cent) or threatened (Vulnerable 17.0 per cent, Endangered 15.9 per cent, Critically Endangered 8.6 per cent). For CITES-listed species, we included the 53,063 species under the three Appendices as potentially sensitive species.
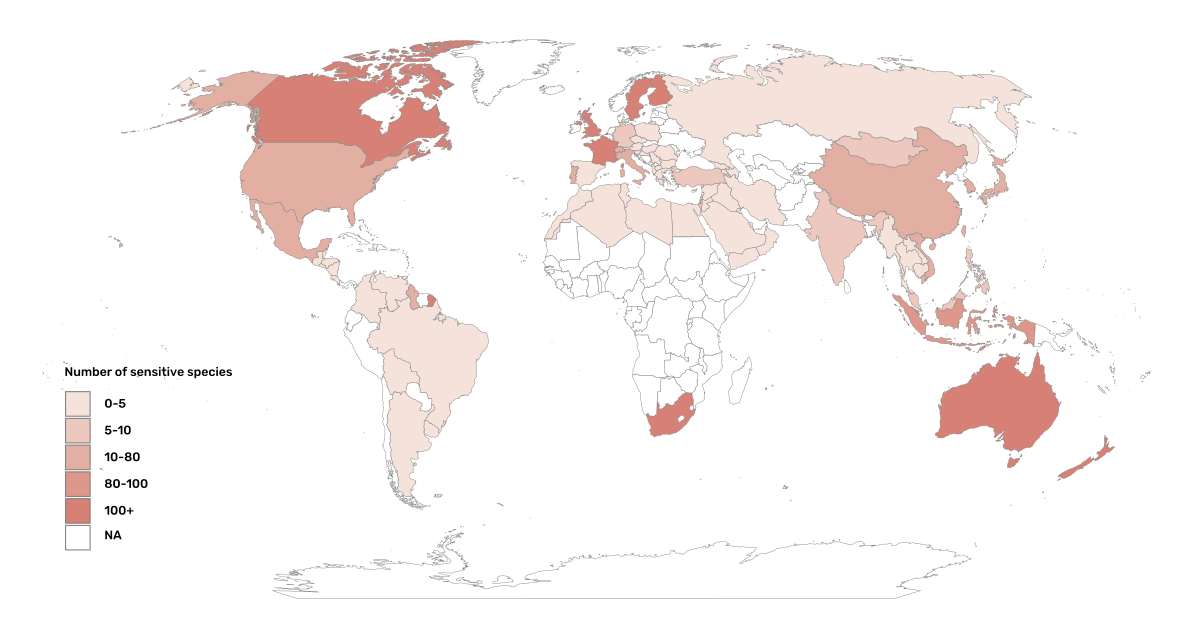
From the nine institutional sensitive species lists we were able to retrieve (Table 1), we compiled 9,232 sensitive taxa covering 91 countries (Appendix B). In some cases, sensitivity was defined not for a species, but for a genus, subspecies or a variety (e.g., Acriopsis sp., Gasteria pillansii var. Hallii, Asplenium x contrei Calle). After matching taxonomic names using the GBIF taxonomic matching tool, we recognized 8,368 species. From these, 5,715 (68.3 per cent) were listed as Not Evaluated (NE), and 532 were not found in the IUCN Red List. Of the remaining species listed, 14.3 per cent were considered as Least Concern, 1.8 per cent as Near Threatened, 3.5 per cent Vulnerable, 3.5 per cent Endangered and 2.2 per cent as Critically Endangered. This combined list was hindered by their unstandardized formats (e.g. exportable Excel or csv files, pdf, text in the web page) and taxonomic mismatches between the organizational lists, the IUCN and the GBIF Backbone Taxonomy.
Looking at the taxonomic composition of the combined national and organizational list, 62.3 per cent of taxa are plants as compared to 33 per cent for those species on the IUCN Red List identified as being threatened by biological resource use. The value of 33 per cent is in contrast to the fact that 41 per cent of all taxa on the IUCN Red List are plants and thus could reflect a lower threat to plants from biological resource use, or could be explained by an incomplete assessment of plant species threatened by biological use, highlighting a potential need for updating assessments to adequately reflect threats to species (Auliya et al. 2016; Siler et al. 2014). It is also important to note that the large number of plant species in the Atlas of Living Australia sensitive species list (4,161 species) skewed the taxonomic composition of the combined national and organizational list towards plants. For CITES-listed species, 84.6 per cent are plants although this may be due to the fact that two large plant taxa are included in the CITES-lists, notably Orchidaceae (34,354 species). The CITES-list also demonstrates taxonomic biases or gaps. For example, reptiles have been widely recognized as susceptible to over-exploitation by unsustainable pet trade; however, the trade of fewer than 8 per cent of reptile species are regulated by CITES (Auliya et al. 2016; Schlaepfer et al. 2005).
When we compared the taxonomic coverage of the IUCN-derived sensitive list (species threatened by biological resource use), the CITES-derived list, and the compiled national and organizational list, we found little agreement. From the 9,232 taxa identified in the compiled national and organizational list, only 220 (2.5 per cent) were found on the list of 12,890 species obtained from the IUCN-derived list (representing 1.7 per cent of species). Therefore, only a few species identified through the IUCN threat scheme enables the identification of species listed as sensitive at national or regional levels. The use of the IUCN threat classification scheme would identify those species at risk of harm at a global level, rather than assessing the intensity of the harm at a local scale—a reflection that the threat of biological use would not be uniform over a species´ global distribution. Therefore, the use of biological use in the global IUCN threat classification scheme may over- or underestimate this threat at a local scale if the intensity of the threat has not been assessed locally. This is in contrast to national or organizational sensitive species lists, where sensitive species are identified using a set of locally relevant criteria and stakeholders.
When we compared the CITES-derived list of species whose trade is regulated internationally with the compiled national and organizational sensitive species list, 1,200 species appear in both (nearly 13 per cent of the species included on the compiled national and organizational sensitive species list). While higher than the filtered IUCN Red List, this number still remains relatively low. Comparisons here are difficult, though, as many of the taxa on the CITES appendices do not occur in the countries for which we have sensitive species lists. For example, most of the more than 34,000 species of Orchidaceae are found in countries without sensitive species lists. The fact that there is some signal in our globally unrepresentative compiled national and organizational list suggests that there may be some utility in using CITES-derived lists for identifying sensitive species, but further exploration is needed in order to define sensitivity at national or regional levels.
The large number of species identified as sensitive in institutional lists and not reflected in the IUCN-based lists was unexpected, highlighting how different approaches at different scales provide different insights. The IUCN Red List of Threatened Species, while useful in identifying species at higher risk of extinction on which publishers may want to generalize data, it does not sufficiently reflect national context to be able to be used generically as a global trigger list. The CITES Appendices may provide better information, but this should be explored following consultation with GBIF nodes and the wider conservation community. Global lists cannot replace national, regional and organizational processes to adequately capture where there may be sensitivity in the data. In a GBIF survey aimed at data publishing organizations within GBIF (Chapman 2006), publishers were able to identify local pressures on species based on their own experience, citing examples such as illegal falconry, collection and baiting (badgers), and important local taxa like amphibians and reptiles, ferns, orchids, cycads, succulent plants and cacti. In one territory, a respondent responded that “digging up of rare plants has not been a problem until now.” This understanding of local contexts and priorities is difficult to disaggregate from global lists.
2. Sensitive species data management in GBIF
In Chapman (2020), generalization refers to any modification performed on source data that conceals sensitive content, which could be related to textual information (name of the area, collector, landowner) or spatial generalizations. For data published through GBIF, the responsibility for generalizing data resides with the publisher. In a survey of data holders by GBIF (Chapman 2006), two thirds of respondents (65) reported that they generalize data in some way, mostly by deleting or altering localities (42), deleting or decreasing the scale of the georeference (41), or modifying the accuracy (1). All the other generalizations were related to non-spatial elements such as collectors' names, dates and taxonomic information.
One of the most common practices used in the management of sensitive data is to generalize the spatial locality or geographic coordinates (Chapman & Wieczorek 2020). Spatial generalization typically consists of reducing the precision of the data through generalization to a grid (metric or geographic), or polygon (e.g., circle, administrative boundaries, biogeographic region, watershed). These generalizations carry with them a coordinate uncertainty that is a function of numerous factors, including coordinate precision, GPS accuracy, data source and measurement errors (Bloom D et al. 2020; Chapman & Wieczorek 2020; Wieczorek et al. 2004). This coordinate uncertainty defines the geographic limits around the point from where the specimen was most likely collected, usually described in metres or kilometres (Bosman et al. 2021). In Appendix C, we summarize some of the recommendations of organizations examined in this analysis.
The generalization of georeferenced data should be documented so that users can evaluate the data’s fitness for use (Chapman & Wieczorek 2020). Omitting this information may considerably reduce the value of the data for analysis, with users often unaware that the data has been modified (Bosman et al. 2021). For example, higher spatial uncertainties may lead to a lower robustness of species distributional models (Contreras-Díaz R G et al. 2023). In order to maintain data quality, reliability and promote reuse, generalization should be documented in a standardized way (Chapman & Wieczorek 2020). In addition, uncertainties due to the methodology used to obtain the occurrence data, for example, should also be documented independently of any data generalization applied (Chapman & Wieczorek 2020).
The extent to which data holders and publishers are applying general GBIF and national data generalization protocols is unknown. It is unclear whether those data that are considered sensitive data are being generalized in a standardized manner both within and outside of a country where that species occurs. In this section, we evaluate the degree to which sensitive data is being generalized and the extent to which data generalization protocols are applied across different geographies and organizations. Finally, we provide examples of how data is currently generalized for some well-known sensitive taxa.
2.1. Application of data generalization protocols within GBIF
In its broadest sense, generalization introduces uncertainty in the location data of an occurrence. Currently, this uncertainty can be captured mainly through five DwC terms : dataGeneralizations (DG), informationWithheld (WH), coordinateUncertaintyInMeters (UNC), coordinatePrecision (CP) and footprint (FT). Of these five terms, Chapman & Wieczorek (2020) recommended the use of DG and WH for generalizations related to sensitive species data. We took the broader definition and looked at the use of the five terms for taxa listed as potentially sensitive, based on our compiled national and organizational list and the list derived from the IUCN Red List to determine how data generalizations were being applied to these subset of taxa in GBIF.
These two lists of sensitive and potentially sensitive species resulted in 21,098 validated taxa (20,205 species recognized by the GBIF taxonomic matching tool). As a first step, we retrieved occurrence data from GBIF using the following filters: occurrences after 1970, with coordinates and excluding records based on fossil specimens, material sample, and living specimens. We retrieved 386 million occurrence records for taxa on any of the two lists (this included records for 117 genera that were listed on national lists) (GBIF.org 2023).
In a second step aimed at exploring generalization patterns for sensitive and potentially sensitive species, we filtered the list of potentially sensitive species to include only those in threatened (CR,EN,VU) or Near Threatened (NT) categories. We considered that this filter could serve as a potential trigger list for identifying those taxa for which publishers might consider generalizing data. With this filter, we obtained nearly 38 million records for 5,728 species. From the national and organizational lists we obtained 13.9 million occurrences for 258 species, and based on the IUCN-derived list, we obtained nearly 38 million occurrences for 5,710 species. Records were sorted by the generalizations applied, publisher, country of occurrence (country code), and publishing country. Species were categorized as those having either generalized or not generalized occurrences (Figure 2). A species was considered as generalized if one or more of the five DwC terms above had been populated and not generalized if none of the five terms were used.
We found that a remarkable proportion of these occurrences (91.6 per cent) were published by institutions in just nine countries: the United States, Sweden, Netherlands, Belgium, Denmark, Norway, France, Australia and the United Kingdom. When we examined the use of the DG term across countries, there were clear differences. For example, Belgium used DG for over 90 per cent of the occurrences for sensitive species followed by the Netherlands (81 per cent) and Switzerland (69 per cent). Nearly 90 per cent of occurrences from Belgium made use of WH, and 91 per cent of the records related to sensitive species from Finland used FT.
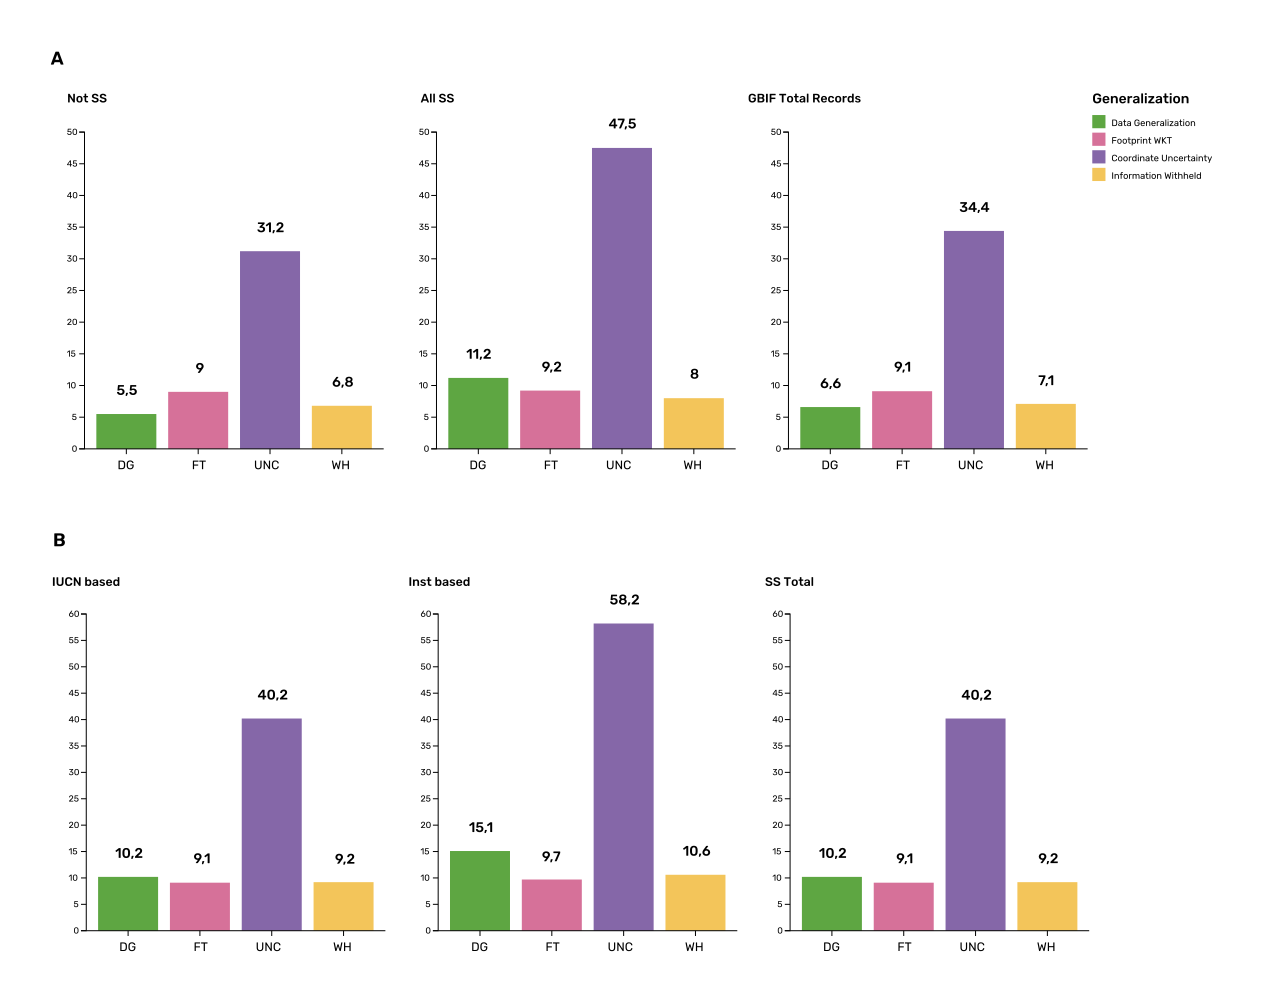
The UNC term was the most commonly used term for species on both lists and across GBIF, but tended to be more extensively used in occurrences of threatened and Near Threatened species on the national and organizational lists (58 per cent of the occurrences). For all species identified as sensitive (both lists, all IUCN categories, for 21,098 validated taxa), UNC was used for 47.5 per cent of the records, higher than when compared with the 34 per cent of records using UNC for all GBIF records (Figure 2, panel A). However, the term UNC may signal spatial uncertainties of short distances that fail to act as efficient generalizations in terms of obfuscating species localities. In fact, when exploring the generalizations of the records related to threatened and near threatened sensitive species, nearly half of the occurrences that made use of UNC term had uncertainties of less than 500 metres, which do not comply with most of the recommended buffer distances provided in guidelines (see Chapman 2020). The term CP was seldomly used, and FT was used to the same extent as for non-sensitive occurrence data in global GBIF dataset (nearly 10 per cent of the occurrences).
Besides UNC, the majority of records (82.9 per cent) for Threatened and Near Threatened sensitive and potentially sensitive species provided no information for the recommended terms relating to generalizations, e.g. WH and DG (Figure 2, panel B), and, therefore, we assume that data is being provided in its original form with no generalization as recommended for sensitive data (Chapman 2006). For records of species in any conservation category, nearly 90 per cent of their occurrence records do not make use of either WH or DG (Figure 2, panel B).
There was little difference between sensitive species (regardless of their IUCN category) and those that were not sensitive in their use of the WH term (8 per cent and 6.8 per cent respectively, Figure 2, panel A) and between all records in GBIF and threatened and near threatened sensitive species records (7.1 per cent and 9.2 per centFigure 2, panel B). However, threatened and near threatened species identified by institutional and organizations tended to have a higher proportion of records with any of the generalization terms.
We identified only 362 species where all their occurrences had been generalized using WH and/or DG. These species with all occurrences generalized tend to have a lower average number of occurrences published (7.6), compared with the average number of occurrences for a sensitive species (6,776) or with those species in which none of their records were generalized (neither WH nor DG, 110 occurrences per species, 2,288 species). What we see is that data generalizations are exceptions, and most records of known or potentially sensitive species are not generalized.
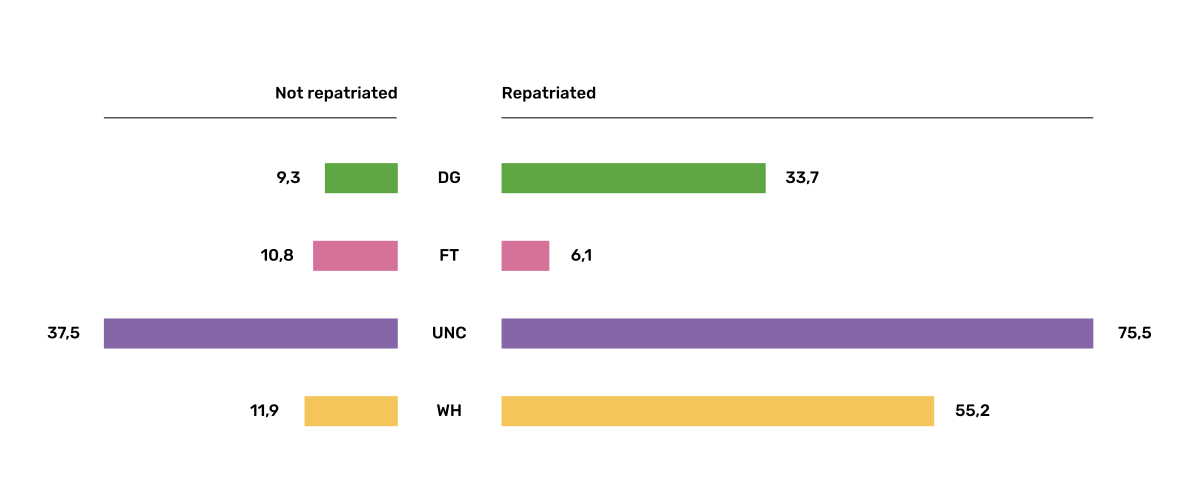
In organizational lists, the sensitivity is generally defined for a specific taxon within a specific administrative boundary, usually at regional or national scales. Therefore, we examined those occurrence records of species on the combined national and organizational list located in the country where they are considered sensitive. We found that nearly 2.8 million occurrences (20.1 per cent) of the 13.9 million records from globally threatened species on national and organizational lists are located in the country or region where they were identified as sensitive. We also found that, for occurrences of species in countries in which they are considered as sensitive, 13 per cent used the WH term and 10 per cent the DG term (Figure 3), compared with the 11 and 15 per cent of occurrences in all countries (Figure 2, Panel A).
Most of these occurrences were published by organizations located within the same country as the occurrences, with only 3 per cent (nearly 770 thousand) of the occurrence records identified as repatriated (i.e. coming from data publishers not within the country where the occurrence was recorded). These repatriated records were more likely to be generalized when compared with non-repatriated records, with 55 per cent of the repatriated records using WH (compared with 8 per cent of non-repatriated records) and 47 per cent using DG (compared with 8 per cent of non repatriated, Figure 3). These different levels of generalization between repatriated and non-repatriated records could be caused to higher levels of sensitivity when publishing data across international borders, or a need for strengthening capacity for generalizing data at national levels. In addition, some countries may be using terms other than WH and DG to generalize occurrences, as in Finland, where FT is widely used in records.
However, the resolution of this analysis at a national level may not have picked up more fine-scale temporal and geographical parameters defined within national sensitive species lists that could lead to our under- or over-estimation of generalization at a national scale. For example, Egernia stokesii is considered sensitive only in Western Australia and would only need to be generalized within its administration boundaries. Our analysis looked at records for Egernia stokesii across all of Australia with no fine-scale regional filtering. Another example is the Finnish Biodiversity Information Facility (FinBIF) sensitive species list that specifies not only smaller administrative boundaries, but also specific seasons in which the occurrence of a species is considered sensitive data, with generalizations only applied during that particular period.
The WH and DG terms can encompass a range of uses beyond than providing spatial uncertainty or data restriction. We explored the information provided for the WH and DG terms by taking a randomly generated subset of occurrences of our listed species in which these terms were used, resulting in 271,157 occurrences from taxa on both our national and organization list and the IUCN-derived list. We manually explored the text provided with the DG and WH columns and categorized them according to content, separating those that mentioned if the record was sensitive from those that did not.
From the 271,157 occurrences, 187,007 had used the term WH, of which only 3.3 per cent referred explicitly to data sensitivity. In these records, the publishers mentioned that data was generalized (withheld) to protect a species under conservation threat (PlantNet, France) or referred to a sensitive species list (Department of Biology, Lund University) (see examples of WH text in Appendix D). In the case of Lund University, the WH field was used for all species in the dataset to highlight that occurrences of three other species were not published because the species are considered sensitive. This example raises the question of the role of metadata versus occurrence-level data for highlighting sensitivities within the data. None of the occurrences where WH had been used to identify sensitivity also provided information for the terms DG, FT, CP or UNC, meanign that the publishers used the WH term exclusively to inform sensitivity. Among the remaining occurrences with WH that did not refer to sensitivity, 57.3 per cent detailed the grid reference system used (e.g. ‘OSGB Grid Reference SO3574’), while for 44.9 per cent of the occurrences the publisher offered additional data under request, such as morphometric measurements, necropsy findings etc. A few records specified that the geographical locations were blurred “as required by the publisher” without indicating the reasons. Finally, among the records with WH not mentioning sensitivity, we found 12.7 per cent (22,992) in which sensitivity was informed using the DG term. Therefore, publishers make use of DG to record sensitivity while also using WH for delivering additional information about the restrictions.
From the 271,157 occurrences, 107,046 occurrences used the DG term and, in contrast to WH with a few occurrences mentioning sensitivity (3.3 per cent), 70.5 per cent indicated data sensitivity. Most of the 40 publishers identified using the DG term in relation to sensitivity gave the same information and text relating to the type and extent of the generalization (in kilometres) and the justification for the generalization (see examples of DG text in Appendix C). In fact, 35 publishers explicitly mentioned the sensitivity of the species, and five mentioned that the data was generalized due to the conservation category of the species. Some publishers also detailed the specific location in which the species were considered sensitive, e.g. specific areas of the country in which data is generalized. This was the case for 24 publishers from the United Kingdom and 12 from Australia. The remaining records used the DG term for providing information on spatial data and temporal issues.
In records with WH and DG referring to data sensitivity, we found several cases in which specific national or local organizations were mentioned as references (Appendix C), which coincide with the institutions from which we obtained the sensitive species list (Table 1), or institutions related to them (e.g., Natural England, Natural Resources Wales, Scottish Natural Heritage, SINP, eBird Australia). Therefore, structured local initiatives may be used by several publishers to identify sensitive species and also to determine the generalizations to be used, probably generating more safe records but also preventing overgeneralizations.
2.2. Examples of sensitive species generalizations
2.2.1. Rhinoceroses
Species from the family Rhinocertidae are well-known targets for poachers and hunters, so we used them as an example to explore the use of data generalizations on their GBIF-mediated occurrence records. We filtered GBIF occurrences for the family, keeping only records with coordinates and excluding observations based on fossils, living specimens and material samples. The resulting data included records for six species (excluding extinct ones) (Appendix D). Among those species (all with accepted species-rank scientific names), there were also five subspecies with accepted scientific names and two were included as synonyms. In total, the six living species presented 3,371 occurrences, from which we excluded 187 located in countries outside their natural distributions (the United States, the Russian Federation, Netherlands and France) that were considered specimens from ex situ collections.
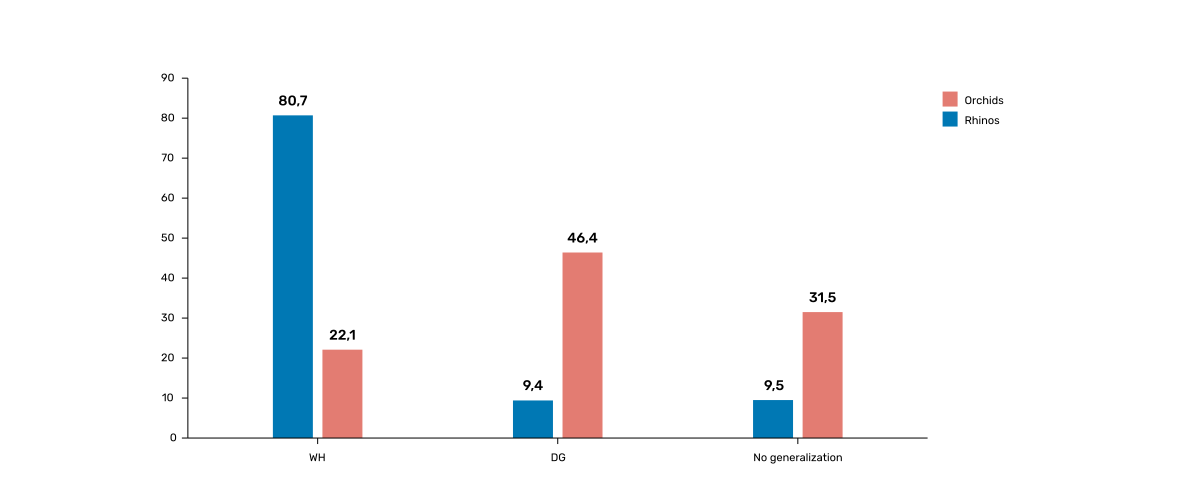
For the remaining 3,184 occurrences, 88.2 per cent were generalized using the WH term, most of them (2,265) using the WH term included explicit indications of sensitivity in the data, e.g. “coordinate uncertainty increased to x metres to protect the threatened taxon” (Figure 4). Only 273 occurrences made use of the DG term (9.4 per cent), but none of them referred to the sensitivity of the species, mentioning only the spatial generalizations (e.g., “record obtained as a central point of a grid with 15 minutes”, “randomly obfuscated between 5-25 km”). In 342 occurrences with no WH nor DG, the record applied UNC, ranging from 1 (12 records) to 12,000 mt (13 records), although most applied 250 metres of uncertainty (220 records). Overall, there were 82 records with no generalization applied (not using any of the selected terms: WH, DG, FT, DP, UNC) for occurrences of Diceros bicornis, Ceratotherium simum and Rhinoceros unicornis.
2.2.2. Orchids
Orchids are one of the largest families of flowering plants with more than 31,000 species globally and commonly traded and are particularly vulnerable to over-harvest because many species have a limited range and/or occur at low densities (Hinsley et al. 2016; Hinsley et al. 2018; Fay 2018). All species are on CITES Appendix II.
We retrieved 16,647 occurrences of threatened orchid (CR, EN, or VU) species in GBIF using similar filters to those for rhinos (GBIF.org 2022a). The records corresponded to 250 accepted species and seven synonyms for accepted names. Of these occurrences, 3,678 (22 per cent) had used the term WH and 7,731 (46 per cent) had used the term DG. In contrast with rhinoceros records, the mention of sensitivity was found for 96.1 per cent of the records with DG and in 60.7 per cent of the WH (Figure 4). All the records that used the WH to signal sensitivity were published by iNaturalist, stating “coordinate uncertainty increased to x metres to protect threatened taxon.” The Swiss National Biodiversity Data and Information Centres (InfoFlora) published the largest number of occurrences (7,352), using DG and the text “in order to respect the currently nationally agreed ethical framework while simultaneously sharing scientifically utilizable data for large scale studies''. Other terms were identified to inform sensitive data generalizations, such as occurrenceremarks (23 records) and georeferenceRemarks (2,114 records). In total, 5,250 (32 per cent) occurrences of threatened orchids were not generalized.
2.3. Data management conclusions
This analysis provides a first effort at assessing the degree to which sensitive and potentially sensitive data is managed across GBIF and this initial assessment, and it shows a mixed landscape. Firstly, most occurrences that we identified as sensitive or potentially sensitive were not generalized even when they were on national lists using WH and DG terms. While this percentage was higher for well-recognized species such as rhinos and orchids, even here significant numbers of records were not adequately generalized. However, a far larger number of occurrences did include coordinate uncertainty values, although these may be under adequate thresholds for effective generalization of data. Secondly, when data is generalized, different publishers applied different generalization protocols, and their practices may be affected by the country in which they’re located, as more occurrences from some countries are generalized than from others. Between publishers, there is a wide variety in the use of Darwin Core terms for identifying sensitivity at the occurrence level, with no fixed vocabulary for the terms and a wide range of different types of information within the fields. The use of occurrence-level indications of sensitivity should be considered at the same time as improved sensitivity metadata. Finally, when we have national sensitive species lists, data coming from publishers outside of the country are more generalized than those from within the country, minimizing the perceived threat of repatriated data with respect to sensitive species data.
References
Adams WM (2017) Geographies of conservation I: De-extinction and precision conservation. Progress in Human Geography 41(4): 534–545. https://doi.org/10.1177/0309132516646641
ALA (2018) What is Sensitive Data? Atlas of Living Australia. https://lists.ala.org.au/public/speciesLists?isSDS=eq%3Atrue
Angarita-Sierra T, Montaño-Londoño LF & Bravo-Vega CA (2022) ID please: Evaluating the utility of Facebook as a source of data for snake research and conservation. Anais Da Academia Brasileira de Ciências 94(suppl.3): e20211043. https://doi.org/10.1590/0001-3765202220211043
Ariño AH (2014) Filling Biodiversity Knowledge Gaps: GBIF supporting research for conservation management. GB21: the 21st meeting of the GBIF Governing Board. Copenhagen: GBIF Secretariat. https://www.gbif.org/sites/default/files/gbif_resource/resource-80932/AArino-Filling-Biodiversity-Knowledge-Gaps.pptx.pdf
Astorga F, Groom Q, Shimabukuro PHF et al. (2023) Biodiversity data supports research on human infectious diseases: Global trends, challenges, and opportunities. One Health 16: 100484. https://doi.org/10.1016/j.onehlt.2023.100484
Auliya M, Altherr S, Ariano-Sanchez D et al. (2016) Trade in live reptiles, its impact on wild populations, and the role of the European market. Biological Conservation 204: 103–119. https://doi.org/10.1016/j.biocon.2016.05.017
Bailey LL, Simons TR, & Pollock KH (2004) Estimating detection probability parameters for Plethodon salamanders using the robust capture–recapture design. Journal of Wildlife Management 68(1): 1–13. https://doi.org/10.2193/0022-541X(2004)068[0001:EDPPFP]2.0.CO;2
Ball-Damerow JE, Brenskelle L, Barve N et al. (2019) Research applications of primary biodiversity databases in the digital age. PLOS ONE 14(9): e0215794. https://doi.org/10.1371/journal.pone.0215794
Bloom DA, Wieczorek JR & Zermoglio PF (2020) Georeferencing Calculator Manual. Copenhagen: GBIF Secretariat. https://doi.org/10.35035/gdwq-3v93
Borgelt J, Dorber M, Høiberg M A & Verones F (2022) More than half of data deficient species predicted to be threatened by extinction. Communications Biology 5(1): 679. https://doi.org/10.1038/s42003-022-03638-9
Bosman A, Steyns H, Muller B & Steenkamp C (2021) NSCF Georeferencing protocol. Version 2.0. Natural Science Collections Facility. https://tdwg.github.io/esp/georeferencing/workflows/NSCF-Georeferencing-protocol.pdf
Boyd C, Brooks TM, Butchart SHM et al. (2008) Spatial scale and the conservation of threatened species: Spatial scale and the conservation of threatened species. Conservation Letters 1(1): 37–43. https://doi.org/10.1111/j.1755-263X.2008.00002.x
Chapman AD (2006) Questionnaire on Dealing with Sensitive Primary Species Occurrence Data Summary of Reponses. Copenhagen: GBIF Secretariat. https://doi.org/10.35035/vs84-0p13
Chapman AD (2020) Current Best Practices for Generalizing Sensitive Species Occurrence Data. Copenhagen: GBIF Secretariat. https://doi.org/10.15468/doc-5jp4-5g10
Chapman AD & Wieczorek JR (2020) Georeferencing Best Practices. Copenhagen: Copenhagen: GBIF Secretariat. https://doi.org/10.15468/doc-gg7h-s853
Contreras-Díaz RG, Nori J, Chiappa-Carrara X, Peterson TA, Soberón J & Osorio-Olvera J (2023) Well-intentioned initiatives hinder understanding biodiversity conservation: Cloaked iNaturalist information for threatened species. Biological Conservation 282: 110042. https://doi.org/10.1016/j.biocon.2023.110042
DECCW (2009) Sensitive Species Data Policy. New South Wales Department of Environment, Climate Change and Water. https://www.environment.nsw.gov.au/resources/nature/SensitiveSpeciesPolicyDEC09.pdf
eBird (2023) Sensitive Species in eBird. eBird Help Center. https://support.ebird.org/en/support/solutions/articles/48000803210-sensitive-species-in-ebird#How-should-eBirders-report-sensitive-species?-
Efford MG & Schofield MR (2022) A review of movement models in open population capture–recapture. Methods in Ecology and Evolution 13(10): 2106–2118. https://doi.org/10.1111/2041-210X.13947
ENETWILD consortium, Jaroszynska F, Body G, Pamerlon S & Archambeau A (2022) Applying the Darwin Core data standard to wildlife disease – advancements toward a new data model. EFSA Supporting Publications 19(11): EN-7667E. https://doi.org/10.2903/sp.efsa.2022.EN-7667
Estrada-Peña A & de la Fuente J (2014) The ecology of ticks and epidemiology of tick-borne viral diseases. Antiviral Research 108: 104–128. https://doi.org/10.1016/j.antiviral.2014.05.016
Fay MF (2018) Orchid conservation: How can we meet the challenges in the twenty-first century? Botanical Studies: 59(1): 16. https://doi.org/10.1186/s40529-018-0232-z
GBIF.org (2023) GBIF Occurrence Download https://doi.org/10.15468/dl.gvxuzs
GBIF.org (2022a) GBIF Occurrence Download. https://doi.org/10.15468/dl.yyw5pj
GBIF.org (2022b) GBIF Occurrence Download. https://doi.org/10.15468/dl.kbwbf3
GEF Montaña (2018) Monitoreo de fauna nativa del GEF montaña registra presencia inédita de gato andino en el Cajón del Maipo. Noticias SIMBIO. https://gefmontana.mma.gob.cl/monitoreo-de-fauna-nativa-del-gef-montana-registra-presencia-inedita-de-gato-andino-en-el-cajon-del-maipo/
Glaser A (2019) Plants and Birds Need Privacy Online, Too. Slate, 4 April 2019. https://slate.com/technology/2019/04/superbloom-california-nature-internet-collide-birds-poaching-science.html
Heberling JM, Miller JT, Noesgaard D, Weingart SB & Schigel D (2021) Data integration enables global biodiversity synthesis. Proceedings of the National Academy of Sciences 118(6): e2018093118. https://doi.org/10.1073/pnas.2018093118
Heinicke S, Ordaz‐Németh I, Junker J et al. (2021) Open‐access platform to synthesize knowledge of ape conservation across sites. American Journal of Primatology 83(1): e23213. https://doi.org/10.1002/ajp.23213
Hinsley A, de Boer H , Fay MF et al. (2018) A review of the trade in orchids and its implications for conservation. Botanical Journal of the Linnean Society 186(4): 435–455. https://doi.org/10.1093/botlinnean/box083
Hinsley A, Lee TE, Harrison JR & Roberts DL (2016) Estimating the extent and structure of trade in horticultural orchids via social media: Social-Media Orchid-Trade Networks. Conservation Biology 30(5): 1038–1047. https://doi.org/10.1111/cobi.12721
Hochachka WM, Fink D, Hutchinson RA, Sheldon D, Wong W-K & Kelling S (2012) Data-intensive science applied to broad-scale citizen science. Trends in Ecology & Evolution 27(2), 130–137. https://doi.org/10.1016/j.tree.2011.11.006
Howe EJ, Potter D, Beauclerc KB, Jackson KE & Northrup JM (2022) Estimating animal abundance at multiple scales by spatially explicit capture–recapture. Ecological Applications 32(7): ee2638. https://doi.org/10.1002/eap.2638
Ichter J, Robert S & Touroult J (2022) Sensibilité des données à la diffusion. Guide technique du SINP. v2.0. Paris: Muséum national d’Histoire naturelle. https://inpn.mnhn.fr/docs-web/docs/download/404525
iNaturalist (2022) Obscuring Sensitive Species Data. https://www.inaturalist.org/projects/hdms-point-observation-database/journal/9042-obscuring-sensitive-species-data
iNaturalist (2023) Frequently Asked Questions: What is geoprivacy? What does it mean for an observation to be obscured? https://www.inaturalist.org/pages/help#geoprivacy
IUCN (2022) Threats Classification Scheme. Version 3.2. https://www.iucnredlist.org/resources/threat-classification-scheme
Kelling S, Hochachka WM, Fink D et al. (2009) Data-intensive Science: A New Paradigm for Biodiversity Studies. BioScience 59(7): 613–620. https://doi.org/10.1525/bio.2009.59.7.12
Kéry M & Schmid H (2004) Monitoring programs need to take into account imperfect species detectability. Basic and Applied Ecology 5(1): 65–73. https://doi.org/10.1078/1439-1791-00194
Lindenmayer D & Scheele B (2017) Do not publish: Limit open access information on rare and endangered species. Science 356(6340): 800-801. https://doi.org/10.1126/science.aan1362
NBN (2019) NBN Sensitive Data Policy. National Biodiversity Network. https://docs.nbnatlas.org/wp-content/uploads/2019/10/National-Biodiversity-Network-sensitive-species-policy_v6-002.pdf
Powney GD & Isaac NJB (2015) Beyond maps: A review of the applications of biological records: Applications of Biological Records. Biological Journal of the Linnean Society 115(3): 532–542. https://doi.org/10.1111/bij.12517
Robinson OJ, Ruiz‐Gutierrez V, Reynolds MD, Golet GH, Strimas‐Mackey M & Fink D (2020) Integrating citizen science data with expert surveys increases accuracy and spatial extent of species distribution models. Diversity and Distributions 26(8): 976–986. https://doi.org/10.1111/ddi.13068
Saarenmaa H (2005) Sharing and Accessing Biodiversity Data Globally through GBIF. 25th Annual ESRI International User Conference (ESRI UC), San Diego, California, 25-29 July 2005. https://doi.org/10.35035/doc-1e12-2d30
SANBI (2010) Biodiversity Information Policy Framework: Principles and Guidelines, Policy Series. Pretoria, South Africa: South African National Biodiversity Institute. http://hdl.handle.net/20.500.12143/7450
SANBI (2016) Report of the National Sensitive Species List Workshop: 18 and 19 August 2016. Pretoria, South Africa: South African National Biodiversity Institute. http://hdl.handle.net/20.500.12143/7451
SANBI (2018) National Sensitive Species List (NSSL) of 2018: Summary of changes. Version 1.0. South African National Biodiversity Institute (SANBI). http://nssl.sanbi.org.za/
Schlaepfer MA, Hoover C & Dodd CK (2005) Challenges in Evaluating the Impact of the Trade in Amphibians and Reptiles on Wild Populations. BioScience 55(3): 256. https://doi.org/10.1641/0006-3568(2005)055[0256:CIETIO]2.0.CO;2
Siler CD, Linkem CW, Cobb K et al. (2014) Taxonomic revision of the semi-aquatic skink Parvoscincus leucospilos (Reptilia: Squamata:Scincidae), with description of three new species. Zootaxa 3847(3): 388. https://doi.org/10.11646/zootaxa.3847.3.4
SINP (2017) Protocole du Système d´Information sur la Nature et les Paysages. Paris: Système d´Information sur la Nature et les Paysages. https://abc.naturefrance.fr/documents/protocole-du-systeme-dinformation-sur-la-nature-et-les-paysages
SLU Artdatabanken (2020) List of sensitive species nationally protected in Sweden. Version 1.6. Checklist dataset. https://doi.org/10.15468/JWBTSB
Soberón J & Peterson T (2004) Biodiversity informatics: Managing and applying primary biodiversity data. Philosophical Transactions of the Royal Society of London. Series B: Biological Sciences 359(1444): 689–698. https://doi.org/10.1098/rstb.2003.1439
Tang B, Clark JS & Gelfand AE (2021) Modeling spatially biased citizen science effort through the eBird database. Environmental and Ecological Statistics 28(3): 609–630. https://doi.org/10.1007/s10651-021-00508-1
Theng M, Milleret C, Bracis C, Cassey P & Delean S (2022) Confronting spatial capture–recapture models with realistic animal movement simulations. Ecology 103(10): e3676. https://doi.org/10.1002/ecy.3676
Thompson CW, Phelps KL, Allard MW et al. (2021) Preserve a Voucher Specimen! The Critical Need for Integrating Natural History Collections in Infectious Disease Studies. MBio 12(1): e02698-20. https://doi.org/10.1128/mBio.02698-20
Tourani M (2022) A review of spatial capture–recapture: Ecological insights, limitations, and prospects. Ecology and Evolution 12(1): e8468. https://doi.org/10.1002/ece3.8468
Touroult J, Birard J, Bouix T et al. (2014) Définition et gestion des données sensibles sur la nature dans le cadre du SINP. Guide technique. Rapport pour le SINP, rapport MNHN‐SPN 2014‐27. https://inpn.mnhn.fr/docs/SINP/sinp_guide_technique_donnees_sensible_v1_avril_2014.pdf
Wieczorek J, Guo Q & Hijmans R (2004) The point-radius method for georeferencing locality descriptions and calculating associated uncertainty. International Journal of Geographical Information Science 18(8): 745–767. https://doi.org/10.1080/13658810412331280211
Wood C, Sullivan B, Iliff M, Fink D & Kelling S (2011) eBird: Engaging Birders in Science and Conservation. PLoS Biology 9(12): e1001220. https://doi.org/10.1371/journal.pbio.1001220
Xing S, Au TF, Dufour PC et al. (2019) Conservation of data deficient species under multiple threats: Lessons from an iconic tropical butterfly (Teinopalpus aureus). Biological Conservation 234:154–164. https://doi.org/10.1016/j.biocon.2019.03.029
Supplementary materials
Appendix A: Conceptual framework for defining sensitive species
| Elements | Description of the elements used to identify sensitive data |
|---|---|
A. Sensitive species: identification of sensitive species |
|
Risk of harm |
* Risk of harm is a result of the use of the targeted species, e.g. if the species is hunted, killed, disturbed, exploited, collected (individuals, seed, eggs), harvested, poached, traded. Also related to the interest that the species invokes in humans (e.g., birdwatching) or a perceived threat to humans out of fear (e.g., spiders), or danger (e.g., bats, snakes) or as pests (e.g., badgers). |
Evaluating the impact of harm |
* Intensity of the activity: Does the activity have lethal ornon-lethal effects on individuals? Are all individuals targeted and at all times of the year i.e. does the activity occur all year or only at specific times? Are there specific life stages (e.g., eggs, mature adults, juveniles) or sexes that are targeted that may affect the demographics of the populations? Is the activity increasing or decreasing? |
Conservation status |
* Species is Critically Endangered, Endangered or Vulnerable at a global, regional, national, or subnational level. |
B. Sensitive data: will the publication of the data increase potential harm to the taxon. |
|
B.1 Species features |
|
Ability to detect and track the species (detectability) |
* Mobility: Species with low mobility (e.g., cactus, molluscs, sedentary species) may be more detectable if specific location data is informed. |
Time and location-specific factors |
* Does the data provide information of nesting/breeding sites of the species? |
B.2 Data content and local context |
|
Public availability of the data |
* Novelty: Is the data is already publicly available in scientific literature, news, social media, atlases, popular knowledge, legal or illegal sources, or findable using an internet search engine? If it’s a novel location for the species, it may be considered more sensitive. |
Protection of the area |
* Consider the effective protection of the area in which the record is located. |
Local legislation and conservation |
* Consider the existence of species-level legislation that may locally protect the species against exploitation |
Potential conflicts |
* Consider land tenure, i.e if the record is located on privately or community-managed lands |
Appendix B: Nationally sensitive species map
Appendix C: Use of Darwin Core terms
| DWCA Term | Text | Comment | Publisher/institution | Species | IUCN Red List Category | Country of the occurrence |
|---|---|---|---|---|---|---|
DG |
Geographic information generalized during aggregation due to the sensitivity of the data to diffusion, according to SINP communication rules |
Many records are published following the same text-forma. Text given in French and English |
UMS PatriNat (OFB-CNRS- MNHN) |
Tetrax tetrax |
NT |
France |
DG |
Location in England is already generalized to 0.01 degrees. Sensitive in ENGLAND, Name: England, Zone: COUNTRY [Sensitive, Natural England] |
Many records are published following the same text-format, and modifying the location, extent of generalization, area in which the taxon is sensitive, and the reference (in this case Natural England) |
Biological Records Centre |
Lutra lutra |
NT |
England |
DG |
Record is Australia in Endangered. Generalized to 10km by Birds Australia. |
Many records are published following the same text-format, and modifying the conservation category, extent of generalization and the reference (in this case, Birds Australia) |
NSW Bird Atlassers |
Dasyornis brachypterus |
EN |
Australia |
DG |
Represents an endangered/threatened species. The specific locality has been removed to protect this species from over-collection. These data may be supplied to researchers on request |
Landcare Research |
Pittosporum patulum |
EN |
New Zealand |
|
WH |
Coordinate uncertainty increased to 29330m to protect threatened taxon |
Many records are published following the same text-format, and modifying the extent of generalization |
iNaturalist* |
Spiranthes brevilabris |
EN |
USA |
WH |
Geographic information generalized during aggregation at the request of the producer |
Many records are given with the similar text. Text given in French and English |
UMS PatriNat (OFB- CNRS-MNHN) |
Neophron percnopterus |
EN |
France |
WH |
Coordinate uncertainty increased to 30003m to protect threatened taxon |
Many records are published following the same text-format, and modifying the extent of generalization |
iNaturalist* |
Ceratotherium simum |
NT |
South Africa |
WH |
Coordinate uncertainty increased to 30699m to protect threatened taxon |
Many records are published following the same text-format, and modifying the extent of generalization |
iNaturalist* |
Ceratotherium simum |
NT |
Zimbabwe |
*As observed, iNaturalist used both WH and DG to describe sensitivity.
Appendix D: Rhinoceros data
| Species | IUCN Red List category | No. of occurrences | No. generalized as DG | No. generalized as WH | Not generalized |
|---|---|---|---|---|---|
Northern white rhinoceros |
CR |
4 |
0 |
4 |
0 |
Sumatran rhinoceros |
CE |
1 |
0 |
1 |
0 |
Black rhino |
CR |
906 |
273 |
495 |
137 |
Javan rhinoceros |
CR |
1 |
0 |
1 |
0 |
Indian rhinoceros |
VU |
351 |
25 |
315 |
36 |
White rhino |
NT |
1,762 |
0 |
1,594 |
168 |
Diceros bicornis bicornis |
NT |
158 |
0 |
158 |
0 |
Total |
3,183 |
288 |
2,569 |
341 |
*Only considering DG and WH