 Improve this document
 Create an issue
 Edit on GitHub
Model Evaluation
You will have to assess the model’s precision and significance — that is, whether the model can correctly predict independent presence (or absence) data and whether the model prediction is better than null expectations. Outputs for your model will include variable response curves and a number of statistics that can be used for assessing the performance of your model.
Variable Response Curves
Variable response curves are model outputs that describe how well your model has characterised how the species responds to the variable. Approximately normal curves may indicate better estimates of the fundamental niche of the species e.g.
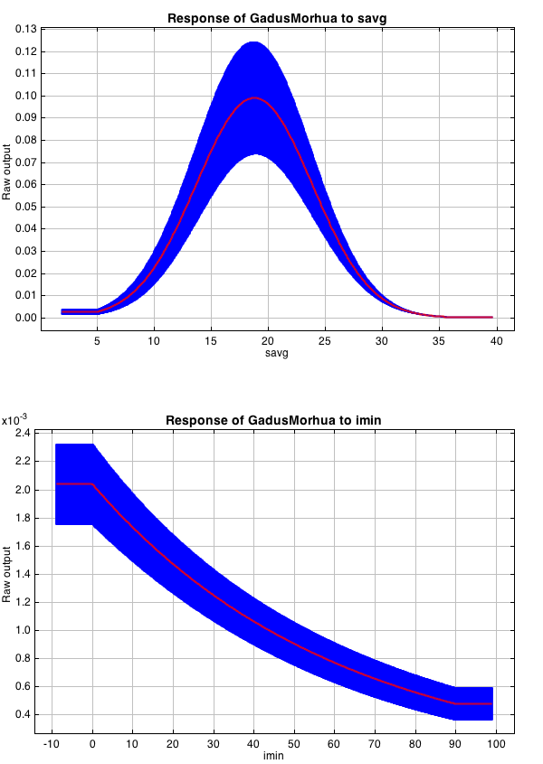
Curves that deviate from normal distributions or are flat, may indicate that the variable may not be a good estimator of a species’s fundamental nicehe. However, some variables such as ice concentrations, the lower curve in the diagram above, do not work like that - very few species can live enclosed in ice!
Statistics
In the ideal modeling scenario… You would seek to identify the ideal model calibration for your data and modeling intent, by comparing:
-
multiple calibration scenarios for an individual algorithm and
-
the best model calibration scenario across multiple algorithms
In the use cases, where you will be dipping your toes into the major theoretical concepts underpinning ENM/SDM, you’ll be looking at only 1 algorithm.
Many options exist for evaluating model calibration scenarios.
Common and accepted approaches are:
-
Akaike Information Criterion (AIC) - AIC is a log likelihood based evaluation metric, commonly used within regression methods. It compares and identifies the best model calibration scenario for an individual statistical algorithm. It balances model fit with model complexity but can NOT be used to compare between different algorithms. We can evaluate the performance of a model i.e. “which model performed better” by choosing the model with the lowest AIC. However, when AICs are only within 2 points of each other, these do not differ significantly and you will need to look at other factors (e.g., variable contribution through variable response curves) that may suggest which (if any) of the equivalent models is more ideal
-
Omission Rate (OR) - compares model performance across algorithms. It is a method of evaluating a model’s ability to accurately predict to test data (typically after applying a threshold). When OR = 0, then no presences were predicted as absent and the model has performed well.