Improve this document
 Create an issue
 Edit on GitHub
Data metrics
| In this section review the various metrics available for datasets. |
One of the many benefits of publishing data via GBIF is that, during the indexing process, GBIF analyses all datasets and produces metrics about them. These metrics are made available in several different ways:
-
global trends
-
country pages
-
dataset content statistics
-
dataset download activity
Participants and publishers can use this information to improve the quality of their datasets, e.g. by addressing issues detected during the indexing process. They can also use the access statistics as evidence of real user interest in their datasets and potential use of the published data.
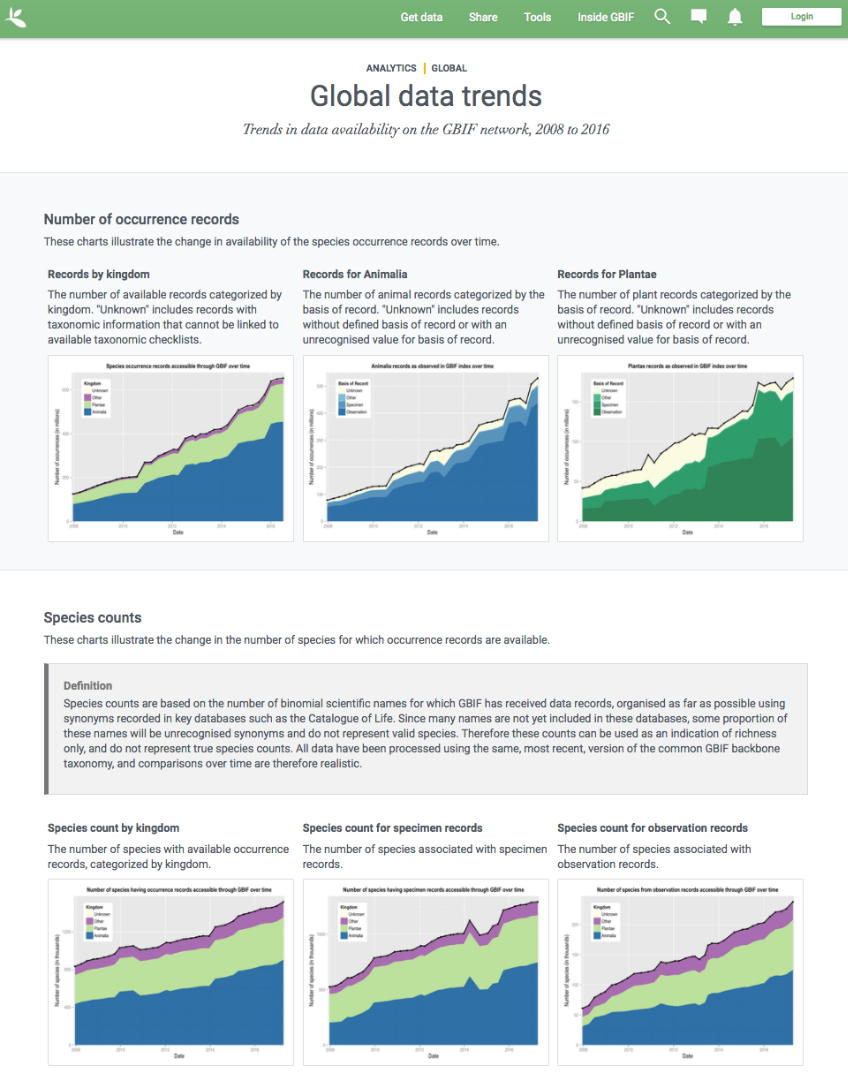
Global data trends
GBIF.org regularly updates analytics to provide an overview of global trends in the data from 2008 to the present. The charts illustrate trends in:
-
occurrence records
-
species counts
-
time and seasonality
-
completeness and precision
-
geographic coverage for recorded species
-
data sharing with country of origin
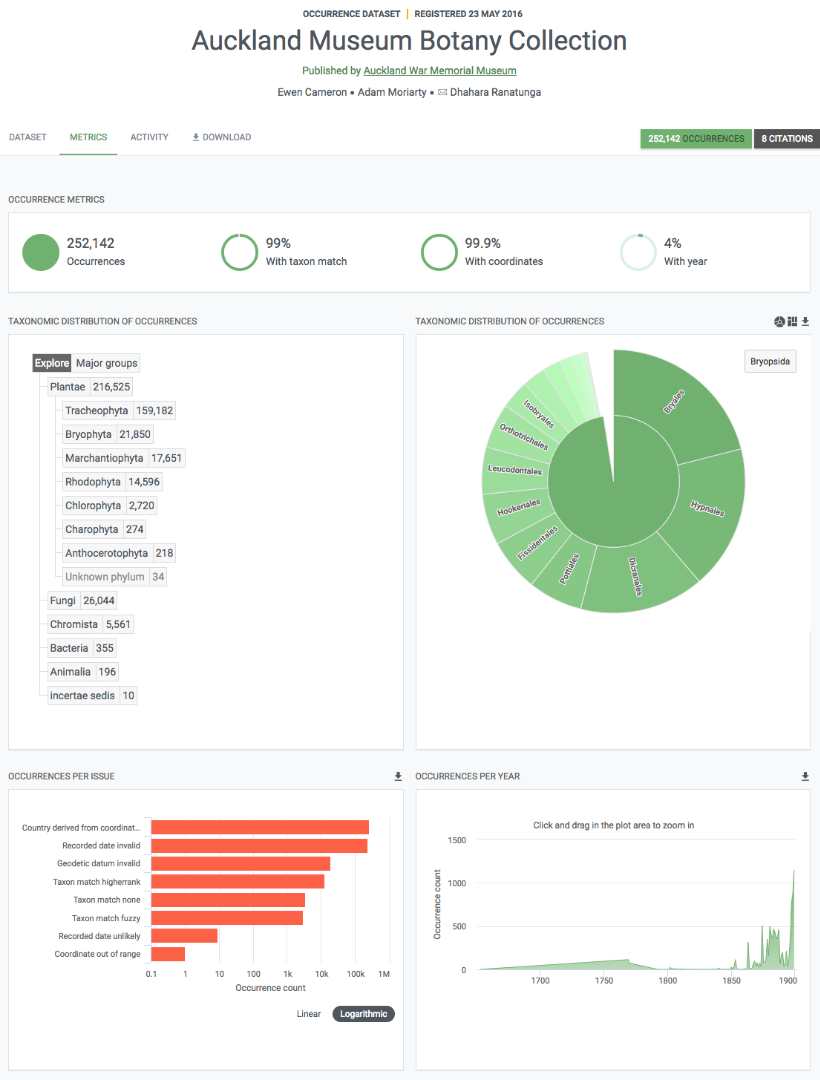
Dataset content statistics
Each dataset page includes a tab labelled ‘Metrics’. This tab gives access to graphs and tables resulting from the analysis of the contents of the dataset. This includes a summaries of:
-
Taxonomic distribution (both list and chart)
-
Occurrences per issue
-
Occurrences per year
The charts/tables are interactive and you can click to filter and explore further. Additionally, the images can be downloaded for reporting purposes.
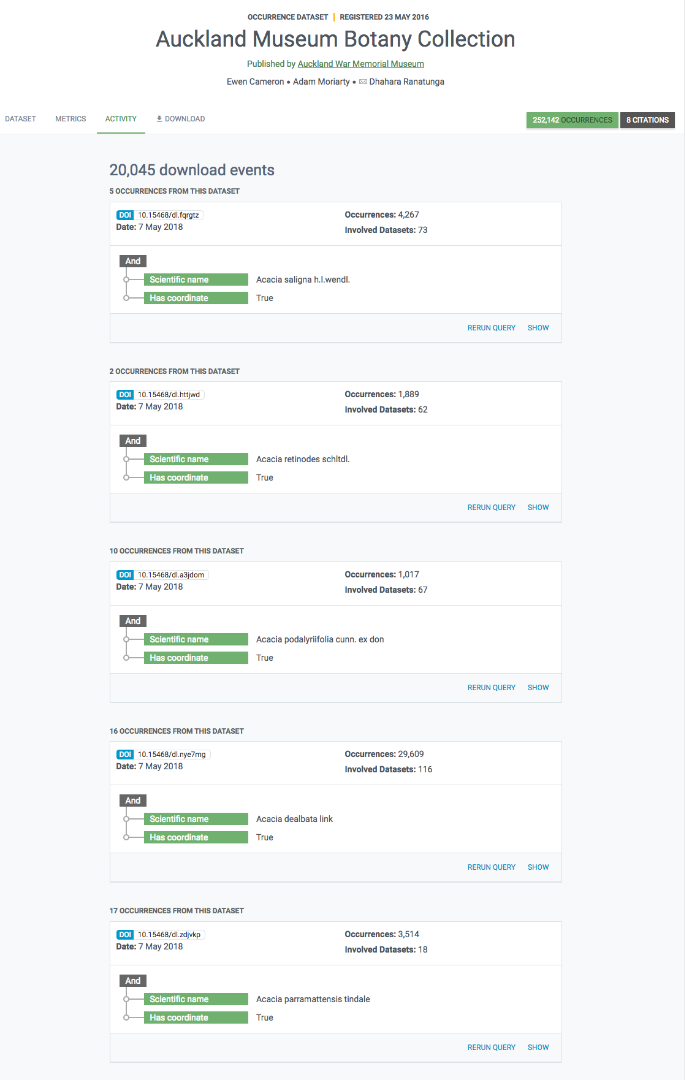
Data access logs
There is a third tab in occurrence dataset pages labelled ‘Activity’. In this tab you can see a list of all download requests that included records from that dataset, including their download DOI for easy tracking.